
blog content
Categories
Recent Posts
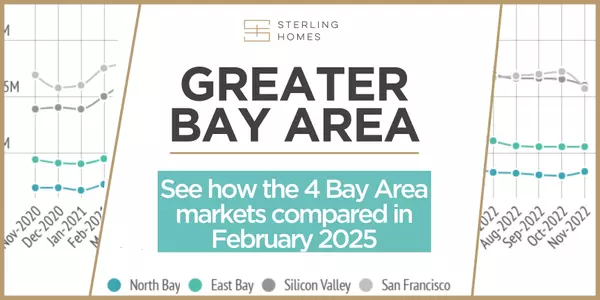
Greater Bay Area Housing Market Update - February 2025
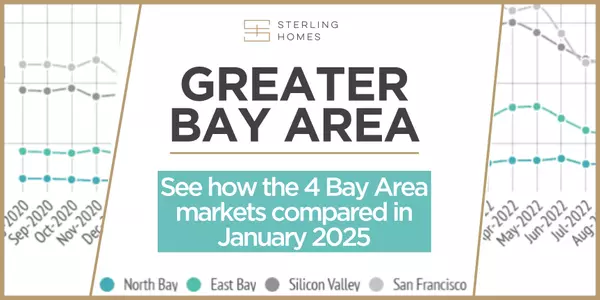
January Housing Market Update 2025

Santa Clara, Santa Cruz, San Mateo Housing Market Update - November 2024

San Francisco Housing Market Update - November 2024

Marin, Napa, Solano, Sonoma North Bay Housing Market Update - November 2024

East Bay (Alameda & Contra Costa) Housing Market Update - November 2024
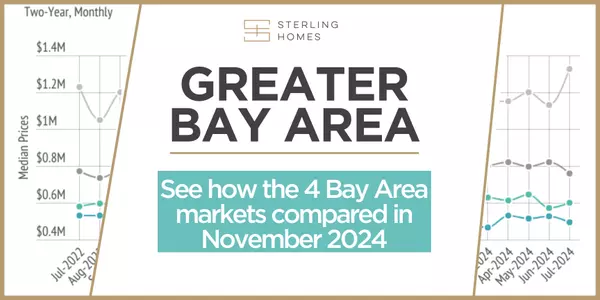
Greater Bay Area Housing Market Update - November 2024

Santa Clara, Santa Cruz, San Mateo Housing Market Update - October 2024

San Francisco Housing Market Update - October 2024

Marin, Napa, Solano, Sonoma North Bay Housing Market Update - October 2024